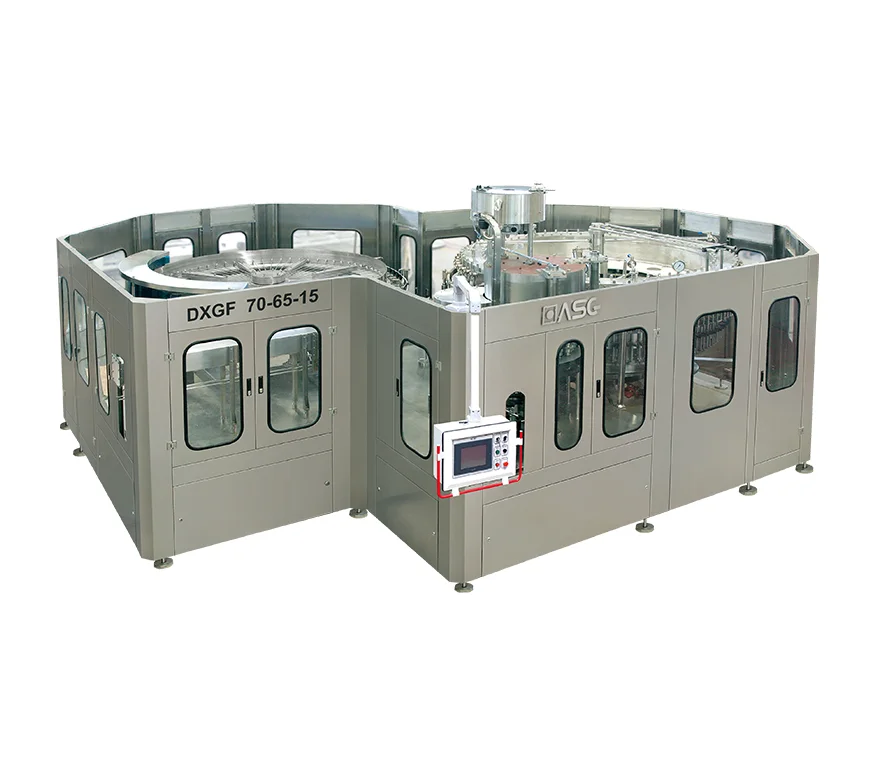

To choose bottling line capacity for multiple formats, calculate the run time each bottle and pack combination needs at its slowest station, then add changeovers and other scheduled stops. In the example below, the packer limits the 330 mL format and the labeler limits the 500 mL format. Compare the line offers by the saleable bottles or packs each format delivers at the same outlet.
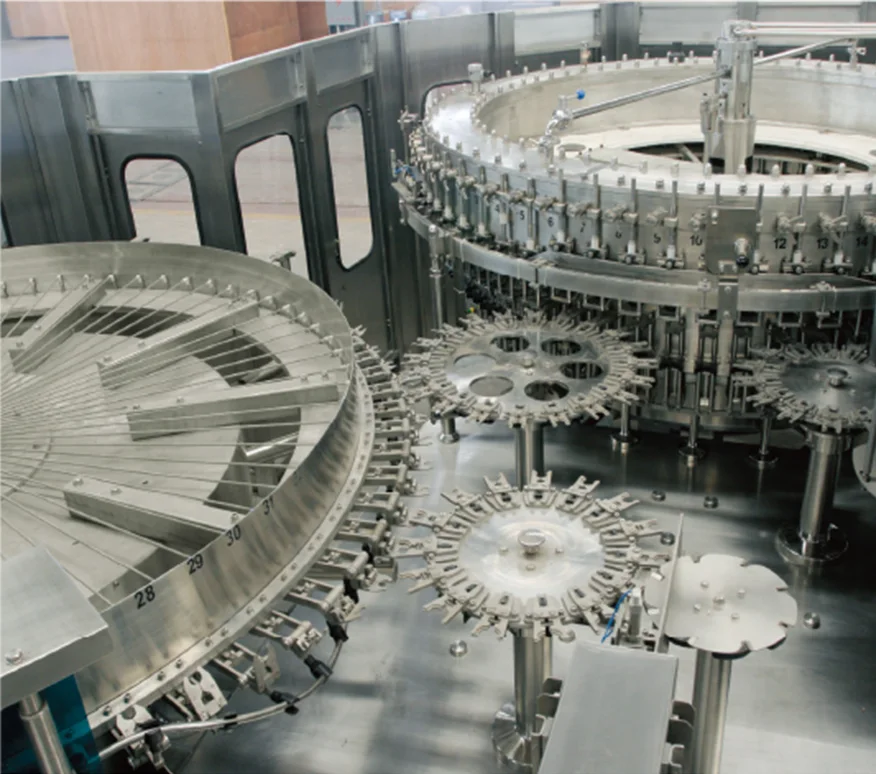
Build the schedule from saleable demand by SKU
Make one row for each stock-keeping unit (SKU). Record the drink, bottle volume and drawing, closure, label, bottles per pack, saleable units needed per shift or week, and the order in which you plan to run the products. A bottle sold in two pack sizes may need two rows because the packaging equipment may run at a different speed for each pack size. Mark products with short runs or tight shipping windows so that a high weekly total cannot hide a missed dispatch date.
Start with the staffed hours when the line can be scheduled. Reserve time for sanitation, planned maintenance, changes of product or format, and breaks that stop production. Count transitions in the actual run order. For example, changing a label roll within the same SKU can be treated differently from changing bottle guides, caps and pack tooling for the next SKU. Define when a changeover starts and finishes. Counting from the last accepted pack of the previous SKU to the first accepted pack of the next SKU gives you a clear measurement boundary.
If the transition window already includes the startup packs that fail quality checks, keep those startup losses out of the running yield assumption. Define the boundary first, then use the same definition when you compare suppliers or evaluate a future schedule.
Put each station on a common rate basis
Ask for demonstrated or proposed running speeds for each relevant SKU. Express each station’s speed in bottles per hour so that the rates can be compared. When a packing machine is quoted in packs per minute, multiply by bottles per pack and then by 60. A machine packing 30 four-bottle packs per minute processes 7,200 bottles per hour. If a palletizer is quoted in pallets per hour and it limits the agreed outlet, multiply by packs per pallet and bottles per pack for the actual pallet pattern.
| Stage | Evidence to request for each format | Typical item to check |
|---|---|---|
| Beverage preparation and feed | Usable litres per hour under the specified product conditions | Divide by litres per bottle for a first-pass comparison. Confirm delivery at the filler inlet. |
| Empty bottle supply and rinsing | Bottles per hour with the selected bottle and handling parts | Check bottle supply and transfer at the proposed pace. |
| Filling and closing | Bottles per hour with the actual drink, bottle and closure | Confirm the specified product temperature, carbonation and quality limits for the proposed rate. |
| Labeling and inspection | Bottles per hour for the actual label and inspection setup | Check the conditions for acceptable labels and when bottles are rejected. |
| Packing and discharge | Packs per minute by pack size, and pallet rate if relevant | Convert to bottles per hour and agree where to count good output. |
For a carbonated beverage, ask for the speed at the specified product temperature and carbonation with the actual closure. The bottle may run through a labeler at its target speed while beverage feed or filling limits the line. Identify both the product-side and package-side conditions before comparing models. Carbonated soft drink filling machines and line configurations
Use the slowest compatible station as the starting point for a sustained line-rate estimate. A conveyor buffer can absorb a temporary mismatch between stations, but it cannot raise the sustained output of a slower station. Ask suppliers how the line restarts after a short stop and whether frequent interruptions change the saleable rate.
Test the schedule with two bottle formats
For this illustrative calculation, an eight-hour shift has 90 minutes set aside for planned stops and transitions. That leaves 6.5 scheduled production hours. The example assumes all stages omitted from the table can sustain the stated limiting speeds. The numbers are planning assumptions for a hypothetical line.
| Input or result | SKU A, 330 mL, four bottles per pack | SKU B, 500 mL, six bottles per pack |
|---|---|---|
| Required saleable bottles | 30,000 | 18,000 |
| Filler running rate | 8,400 bottles per hour | 7,200 bottles per hour |
| Labeler running rate | 7,800 bottles per hour | 6,600 bottles per hour |
| Packer running rate | 30 packs per minute, or 7,200 bottles per hour | 24 packs per minute, or 8,640 bottles per hour |
| Limiting running rate | 7,200 bottles per hour at the packer | 6,600 bottles per hour at the labeler |
| Saleable rate after assumed losses | About 6,350 bottles per scheduled production hour | About 5,821 bottles per scheduled production hour |
| Scheduled production hours needed | 4.72 hours | 3.09 hours |
Here the limiting running rate is measured while the machines are running and before product rejects. To estimate the saleable rate per scheduled production hour, multiply it by the assumed uptime during that window (90%) and by the assumed share of output that meets acceptance criteria (98%). The two SKUs need about 7.82 hours in total when calculated before rounding, so the schedule is about 1.32 hours short. The limiting station changes with the SKU. A faster filler alone leaves the modeled shortfall in place. Compare options such as more packing capacity on SKU A, greater labeler throughput on SKU B, a revised run sequence or more scheduled production time. Recalculate both rows for each option.
If a supplier already quotes net saleable packs per elapsed hour, ask which stops and rejects that figure includes. Apply only adjustments for losses outside its measurement boundary. Applying another uptime or yield factor for losses already included understates capacity. Leaving unmeasured losses out of a running-rate estimate overstates it.
Use the ASG model table to shortlist, then specify the test
Jiangsu ASG Packaging Machinery Group lists the DXGF24/24/8 at 8,000 bottles per hour and the DXGF32/32/8 at 12,000 bottles per hour in its published carbonated beverage filling equipment table. Use those entries as model references. Ask which bottle, beverage, closure and operating conditions the proposed capacity covers, and request a separate rate for each required format at the agreed line outlet. ASG manufacturer parameter table · ASG DXGF series equipment details
At factory acceptance testing (FAT), agree what the supplier can run with your actual bottles, caps, labels and packing materials. Specify the test duration, acceptable finished units, the count location, and the way stops and rejects are logged. If a downstream machine or actual beverage cannot be included, record the factory test boundary and carry the missing item forward to site acceptance testing (SAT). At site, test the integrated line under the agreed product and utility conditions and record at least the selected limiting format and the planned changeover that most affects the schedule. Carbonated drink filling RFQ and acceptance guide
Frequently asked questions
Should I buy a filler that matches the busiest SKU?
Use the busiest SKU to set a demand case, then calculate the hours needed for every SKU and the total changeover time. A high-volume product may be easy to run, while a slower format or a demanding pack drives the capacity requirement.
How much spare capacity should I specify?
Model a defined demand increase, a longer changeover or more downtime, then see which station limits the schedule in each case. Write down the assumption behind the extra capacity and ask whether a later upgrade can address that station. One percentage across every machine can hide where extra capacity is actually needed.
Can a short factory run prove weekly production capacity?
A short run can establish a rate and quality result for the tested configuration. Compare that evidence with the full schedule of formats, staffing, sanitation and expected interruptions. Agree which assumptions must be checked on the installed line.
What if the packer and filler are quoted in different units?
Convert both to bottles per hour for each SKU. Use the actual number of bottles in one pack and confirm that the rate applies to the proposed label, wrap or carton. Use saleable output at the agreed outlet for the final comparison.
Share your SKU schedule with ASG
Send the bottle and closure drawings, target volumes by SKU, pack formats, run order and available hours. Ask ASG to identify the limiting station by format, propose rates at the outlet and set out the corresponding acceptance checks. Discuss bottling line capacity with ASG